
What is Heat Treatment?
Heat Treatment is the process of heating and cooling of materials in a control manner to alter their mechanical and chemical properties. This process is achieved by heating the material to a specific temperature and holding it there for a designated time, followed by cooling it at a specific rate, to achieve the desirable results. The main objective of heat treatment is to improve the material’s mechanical properties, such as hardness, strength, ductility, toughness and properties like corrosion resistance, wear resistance and electrical conductivity.
After Heat Treatment the microstructure of the material depends on the specific process used. Generally the microstructure of the material can be altered through changes in crystal structure, grain size and other impurities within the material. The microstructure of the material after heat treatment is critical to its final properties. Thus, understanding the microstructure changes included by heat treatment is crucial for optimising the performance of the material and its intended use.
Table of Contents
ToggleThe Key Benefits of Heat Treatment and why it’s done?
The Objective of Heat Treatment is to alter the physical and chemical properties in order to improve their mechanical properties.
There are several reasons why heat treatment may be necessary, including:
- Improve Strength by altering the microstructure after Heat Treatment. This can be done by Hardening the material to the desired temperature and changing the microstructure in quenching and strengthening the material after tempering to remove the brittleness and to relieve stress making the metal easier to weld or machine.
- Increase Hardness by heating the metal to a specific temperature and then cooling in whatever medium necessary according to the requirements . The formation of a finer perlite and ferrite microstructure which can be obtained during slow cooling in ambient air also helps to increase hardness. If the cooling happens even faster -for instance, by quenching the steel at about 1,000° Celsius per minute which results in a complete depression of carbide formation and forces the undercooled ferrite to hold a large amount of carbon atoms. This generates a new microstructure, Martensite.
- Increase Machinability by softening certain materials to a specific temperature above the upper critical temperature and then cooled at slow rate according to the requirements. ‘Annealing’ is the process of Heat Treatment in which the treater can increase the Machinability and this is typically performed on “hardenable” ferrous alloys to reduce hardness, increase ductility and increase in machinability of metal.
- Improve Toughness by altering the microstructure after heat treatment. This is achieved by heating the material to a specific temperature and then quenching it in a liquid such as oil or water, after quenching the formation of austenite to martensite occurs and in order to increase the ductility and toughness of a certain material, martensite is heat treated by a process called Tempering.
Strength typically decreased by increasing the tempering temperature and time but the toughness of the material increases in this process.
- Remove residual Stresses, which can improve their stability and reduce the likelihood of cracking or failure. This process is the treatment of a metal or alloy by heating to a predetermined temperature below its lower transformation temperature followed by cooling in air.
Some of the processes such as hot rolling, welding, grinding, cold working and any type of cutting can create stresses at granular level can be removed with this process, with the help of this process the internal structure of the metal is realigned and eliminate the risk of failure which leads to increase in life cycles.
Effects of Time and Temperature Transformation(TTT) ?
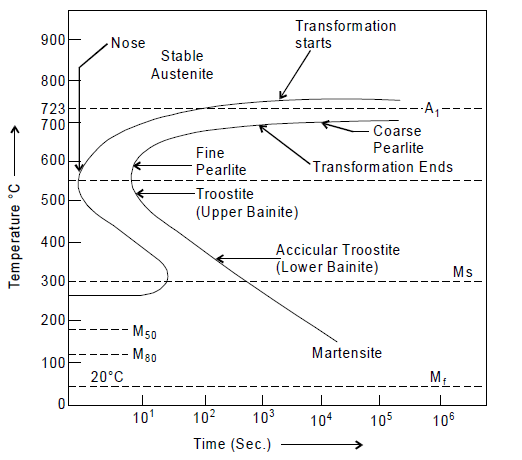
Time Temperature Transformation(TTT) diagrams are used to understand the transformation that occur in materials during heat treatment. The plot shows the transformation of austenite into different phases (pearlite, bainite and martensite) at different temperature and times.
This is also known as Isothermal Transformation Diagram which are plots of temperature versus time (usually on a logarithmic scale). The TTT Diagram shows the relationship between temperature, time and the transformation of austenite to other microstructure of a material which have a significant impact on its mechanical properties as well. By controlling the cooling rate of a material during heat treatment, the TTT diagram can help determine the final microstructure and properties of the material.
The Slow cooling rate can lead the formation of pearlite which has good strength and toughness where as a faster cooling rate can lead to the formation of bainite or martensite, which have higher strength but lower toughness.
In simple terms the TTT Diagram is based on the cooling rate of the material, which determines the time available for the transformation of austenite into different microstructures.
The TTT Diagram Typically consists of three main regions:
1. Austenite region:
This region is above the eutectoid temperature, where the material is fully austenitic.
2. Transformation region:
The Transformation region is where austenite transforms into other microstructures, depending on the cooling rate and time at a specific temperature.
3. Isothermal region:
This region is where the material is held at a constant temperature to allow for the completion of the transformation to the desired microstructure.
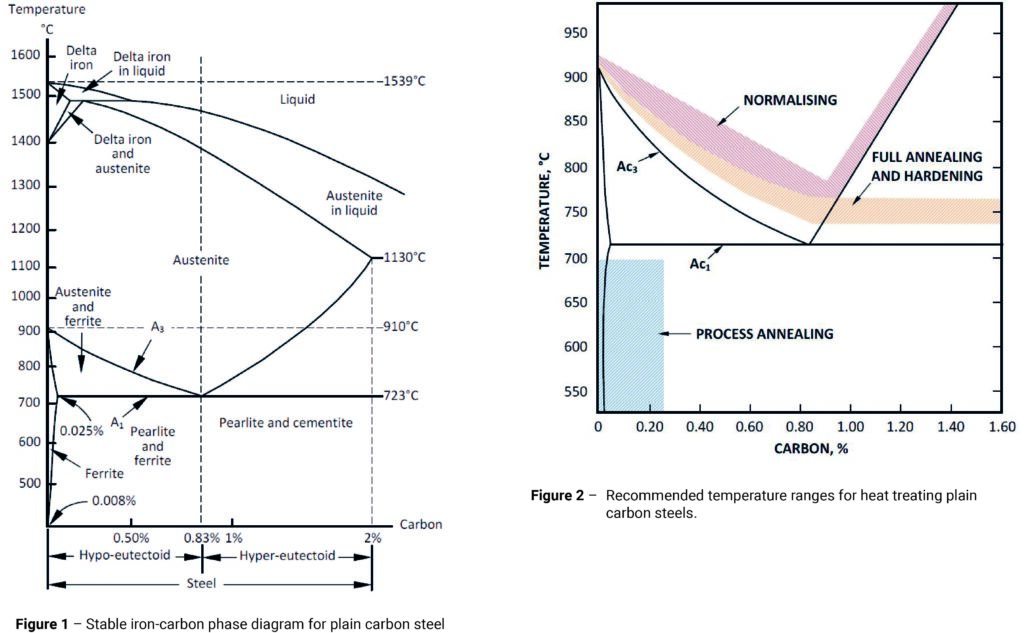
The lower critical temperature of the material is represented by The first curve which is A1 curve , at this lower critical temperature the austenite begins to transform into ferrite and pearlite.
The second curve is the A3 Curve which represents the upper critical temperature of the material, at this temperature the austenite begins to transform into delta ferrite and gamma austenite.
The Third curve is the TTT curve which shows the time and temperature required for austenite to transform into pearlite.
The Forth curve is the TTT curve which shows the time and temperature required for austenite to transform into bainite.
The Fifth curve is the TTT curve which shows the time and temperature required for austenite to transform into martensite.

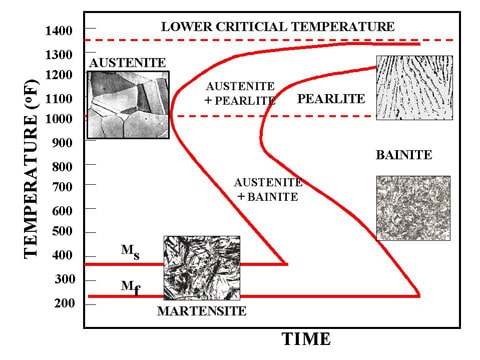

The above images shows the microstructure after transformation of austenite to different structures depending upon the cooling rate and holding time at specific temperatures.
What is Ferrite, Austenite, Pearlite, Cementite, Martensite, Bainite, Tempered Martensite?
Ferrite
Austenite
Pearlite
Cementite
Martensite
Bainite
Tempered Martensite